


2026年的全球能源與金融危機並非憑空出現,它是過去十多年已辨識出來、沙盤推演、並廣泛傳播的地緣政治趨勢與戰略脆弱性的總體體現。一系列名為「石油衝擊波」(Oil Shockwave)的推演,特別是2009年在北京舉行的關鍵演習,為當前局勢提供了極具前瞻性的藍圖[註1]。
儘管西方國家在很大程度上未能對沙盤推演的警告採取行動,但中國卻展開了為期17年、耗資數兆美元的系統性努力,旨在讓自己免受所揭示的脆弱短板影響。本文透過八個數據圖表來敘述這過程:中國自2009年起,如何有條不紊地解決對海上咽喉要道、西方航運與保險、美元的依賴,以及戰略能源緩衝儲備不足的問題。
正如2026年伊朗與美國、以色列的戰爭顯示,中國成為最具韌性的主要經濟體,而美國及其盟友則最容易受到衝擊。這場危機正加速全球權力的結構性轉移,從單極的美元計價體系轉向以北京為中心、擁有強大金融與物流架構並行的多極世界。
超級大國的藍圖
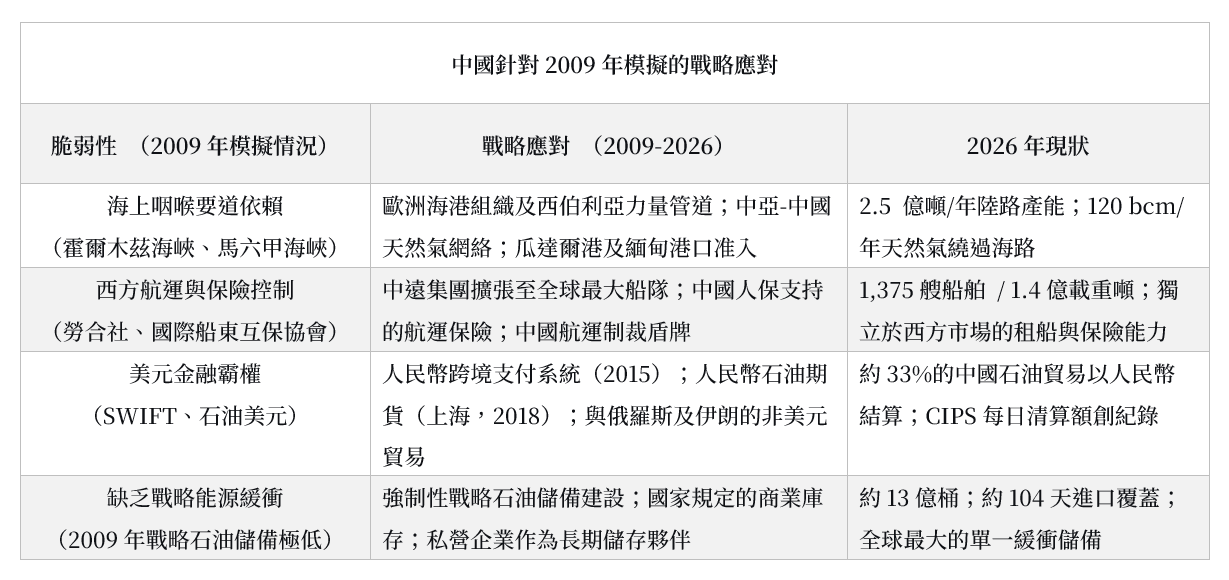
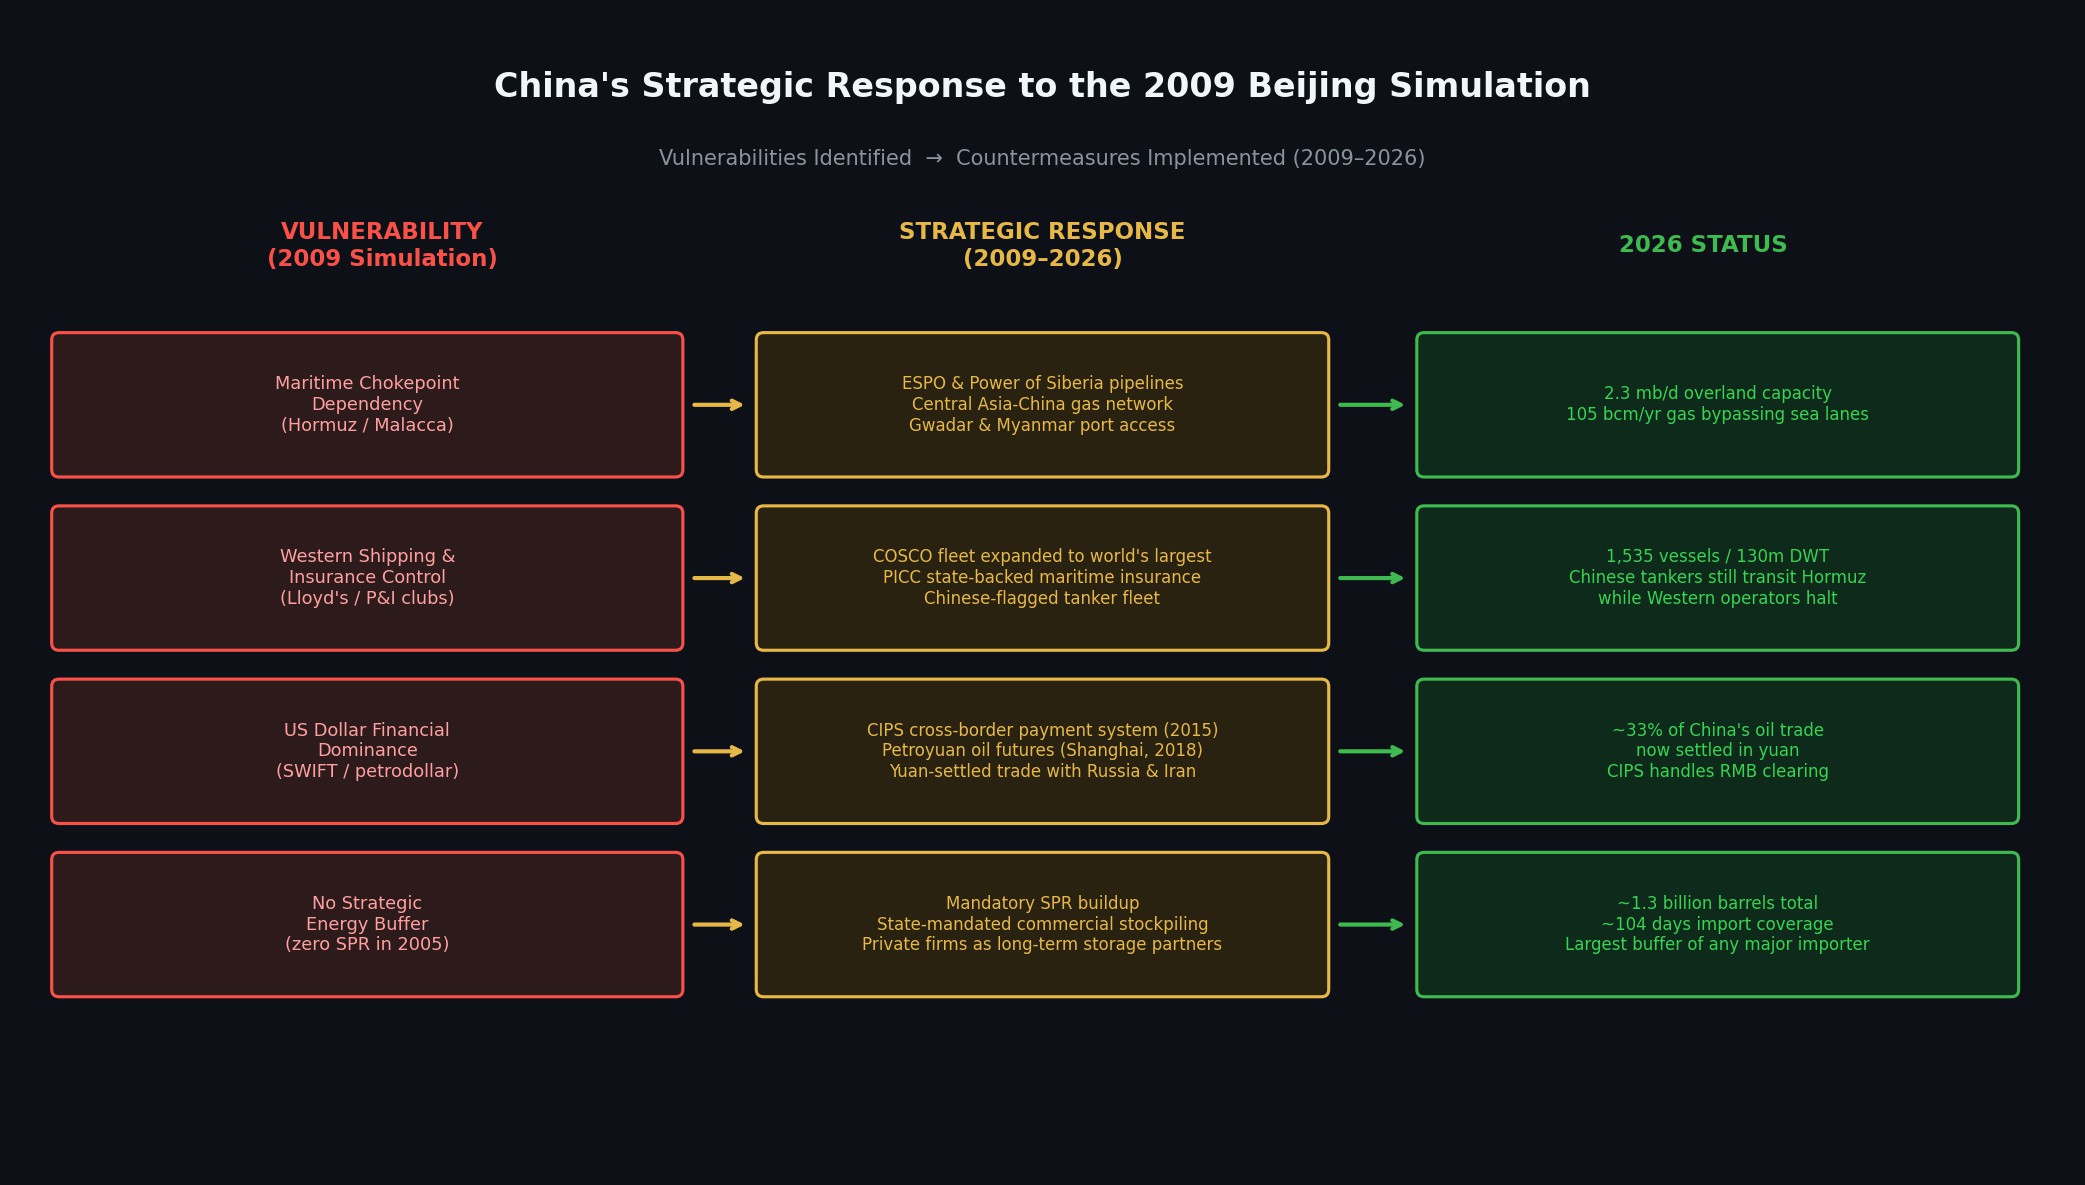
2009年的北京推演是關鍵的轉折點,如下圖所示的推演,為當年全球最大、且增長最快的能源進口國──中國,識別出四個致命的弱點:
打造韌性的萬里長城
弱點 1:缺乏戰略緩衝
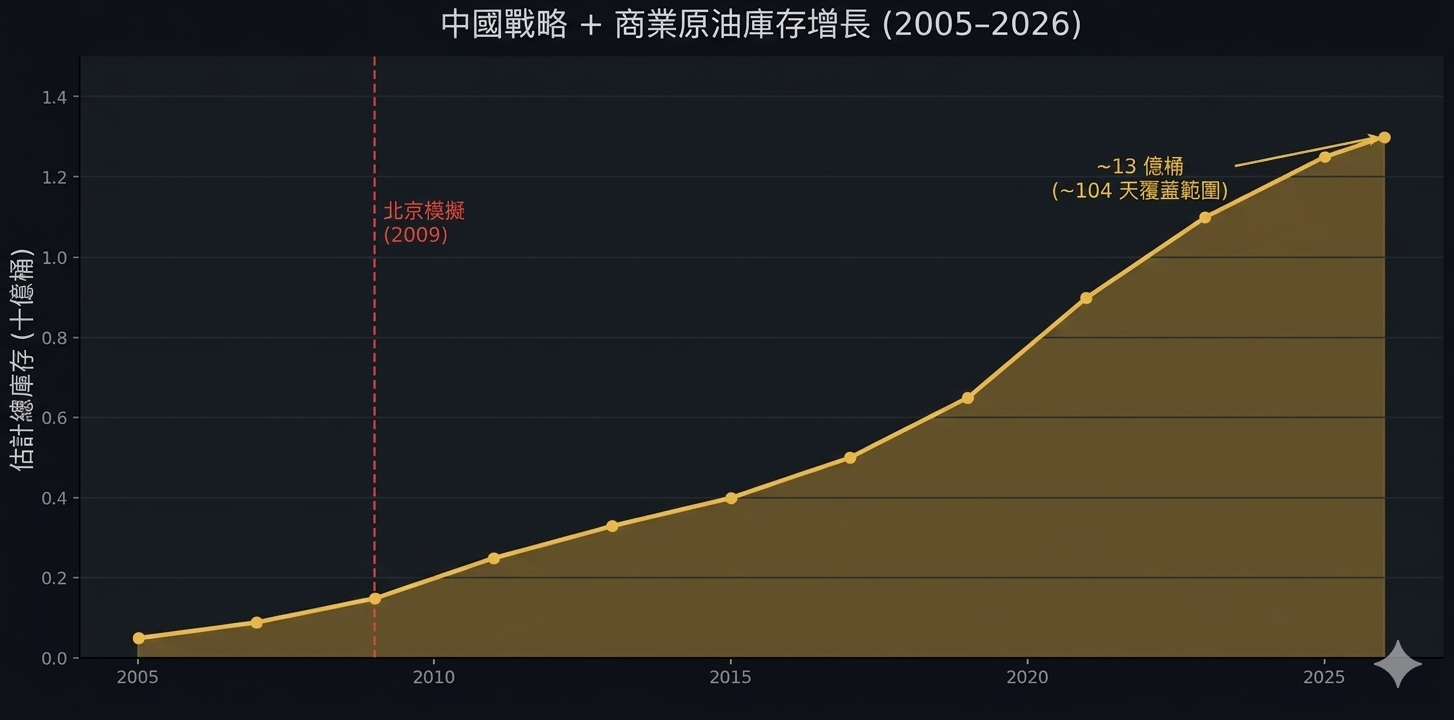
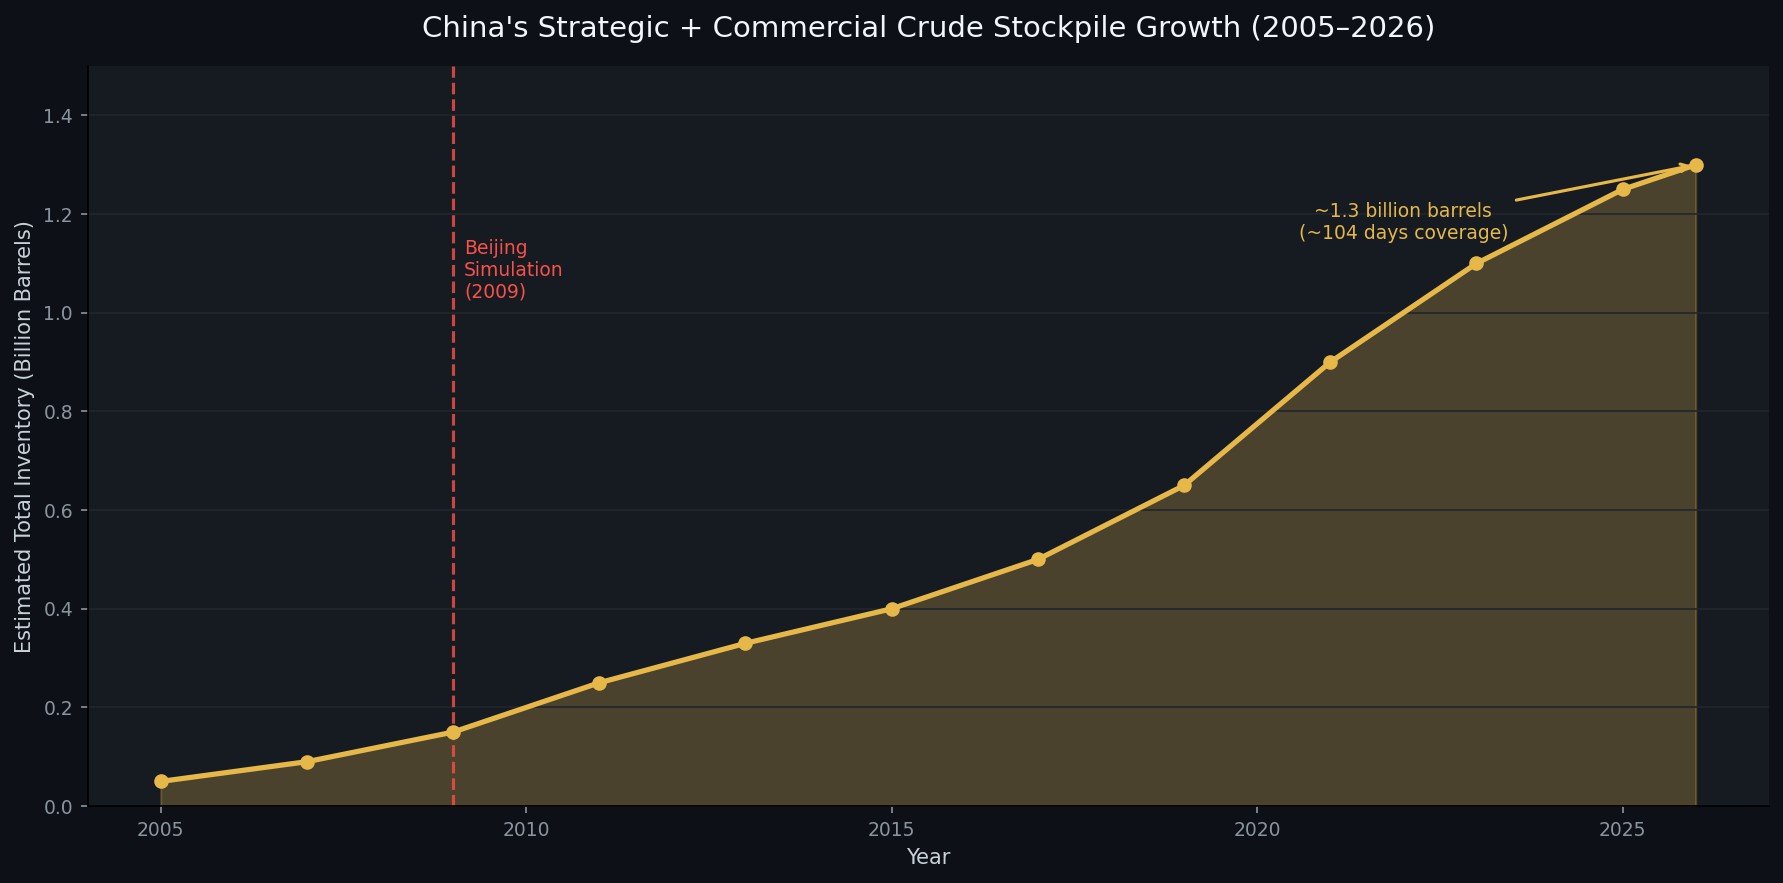
2009年,中國的戰略石油儲備(SPR)微不足道,推演顯示這是致命弱點。下圖顯示了政策轉變帶來的顯著結果:中國的戰略與商業原油庫存呈現近乎指數級的增長,從2009年的約1.6億桶增至2026年估計的13億桶[註2, 註3]。這筆龐大的緩衝覆蓋逾100天的進口量,目前是全球規模最大的,也是中國應對危機的基石。
弱點 2:海上咽喉要道依賴
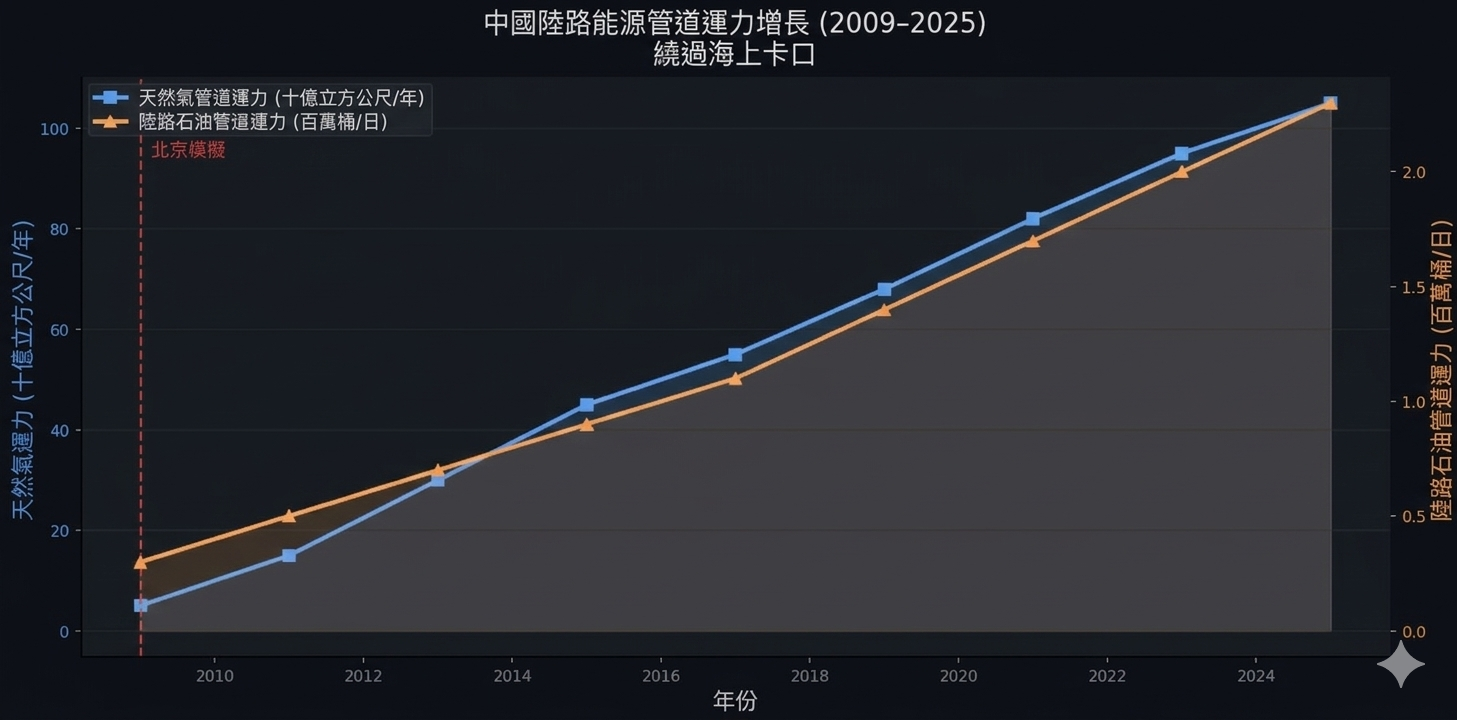
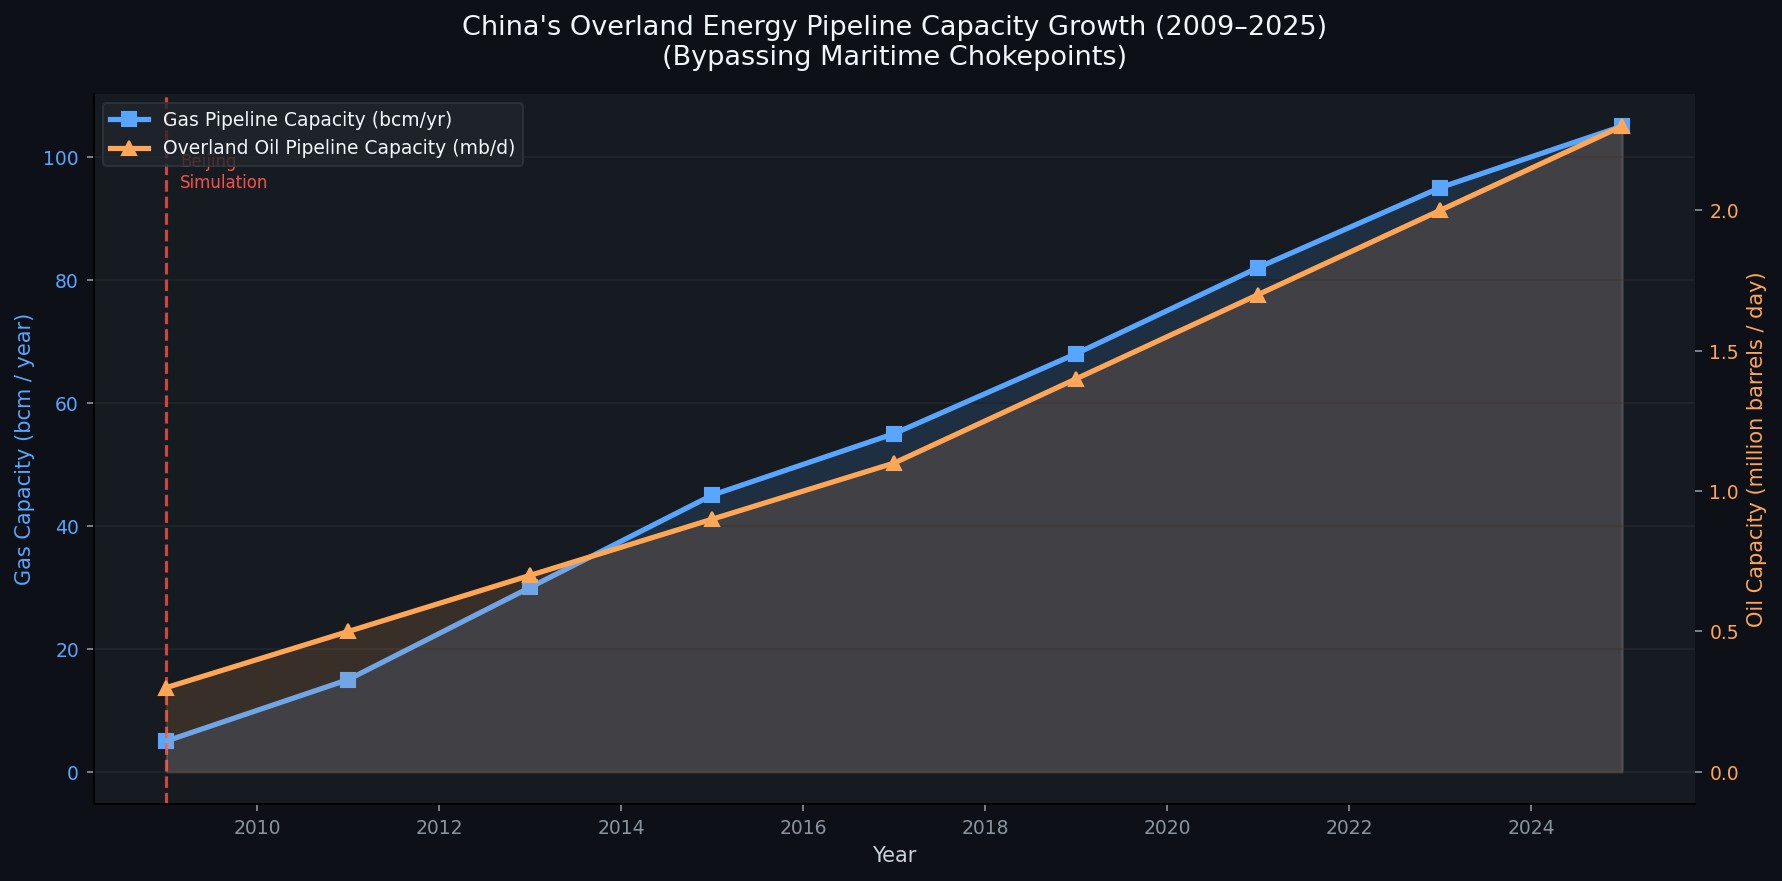
中國曾極度依賴霍爾木茲海峽與馬六甲海峽。為緩解此問題,中國投入數千億美元建設陸路管道。下圖顯示了這些替代基礎設施的穩定增長。到2025年,中國已建立超過每日250萬桶的陸路石油進口能力、以及每年120bcm的天然氣產能,主要來自俄羅斯和中亞[註4, 註5],這些管道對海上封鎖具有免疫力。
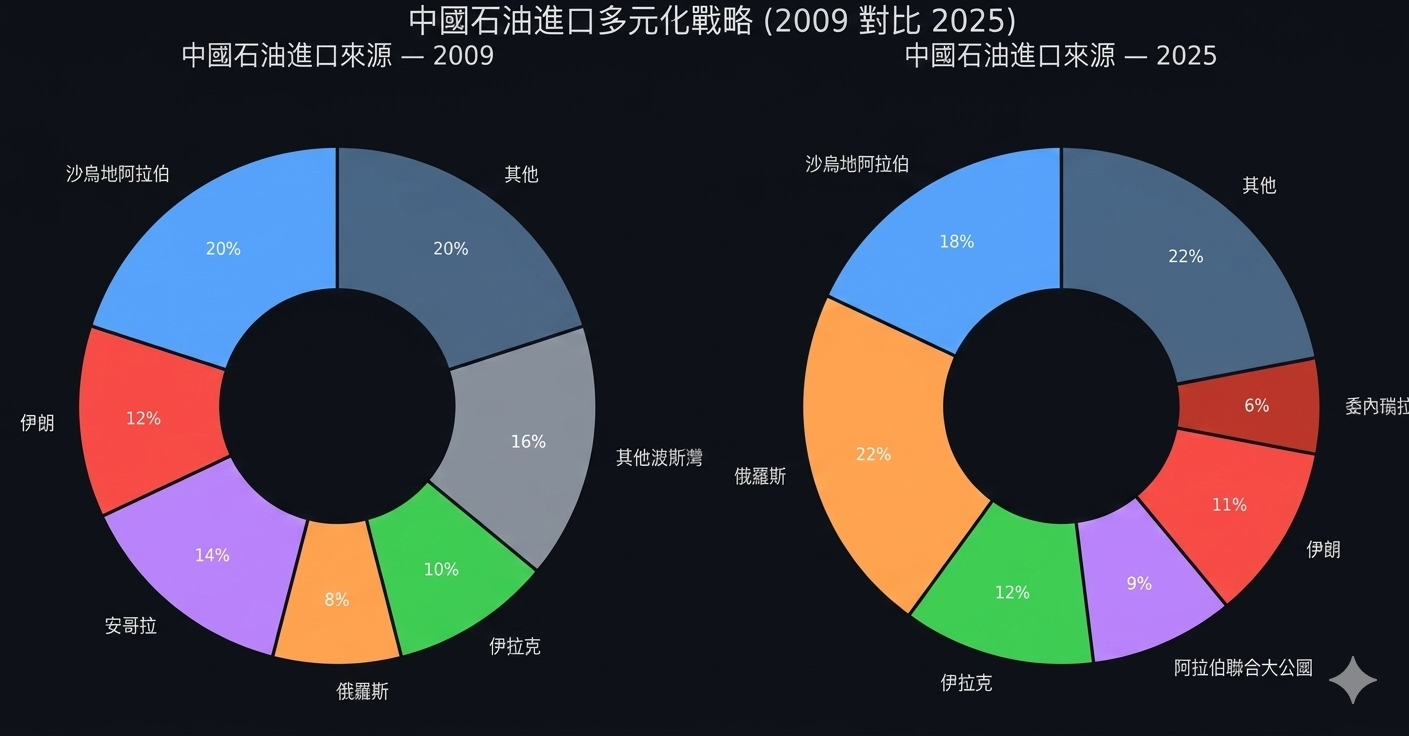
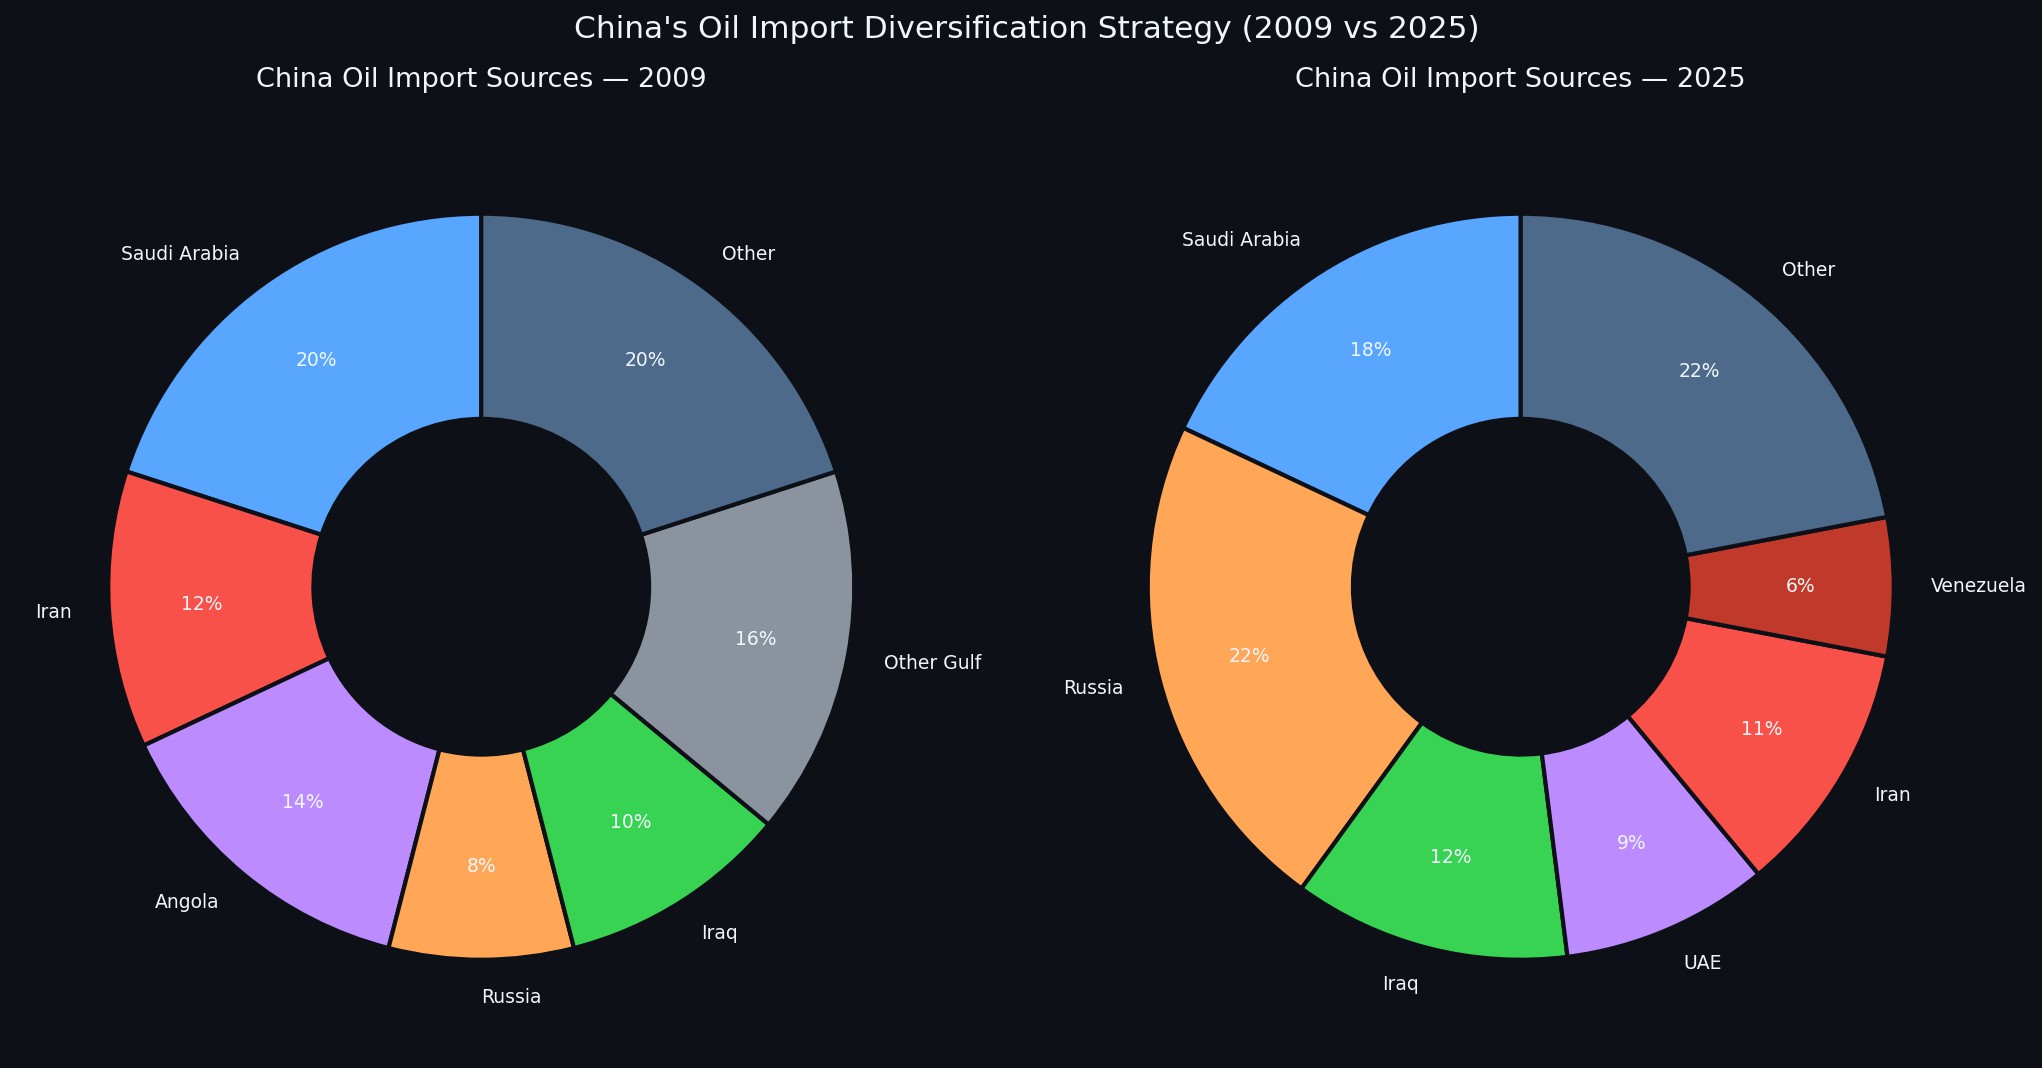
此外,海路供應來源也實現了多樣化。下圖顯示了2009至2025年間的轉變:依賴沙特阿拉伯的程度下降,而俄羅斯的份額從8%增長到 22%,成為中國最大的單一供應國 [註6]。這降低了來源集中的風險,並轉而向擁有陸路通道的戰略合作夥伴進口。
弱點 3:西方航運與保險控制
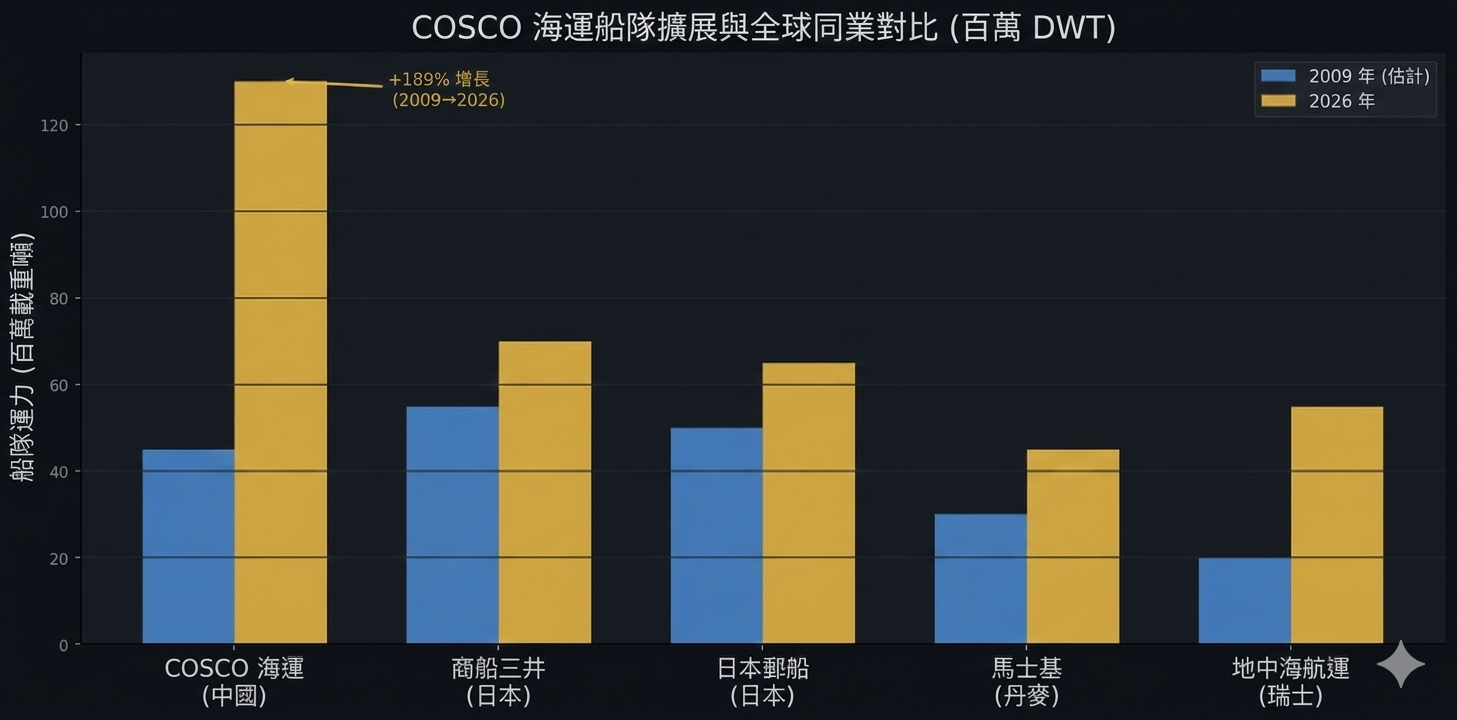
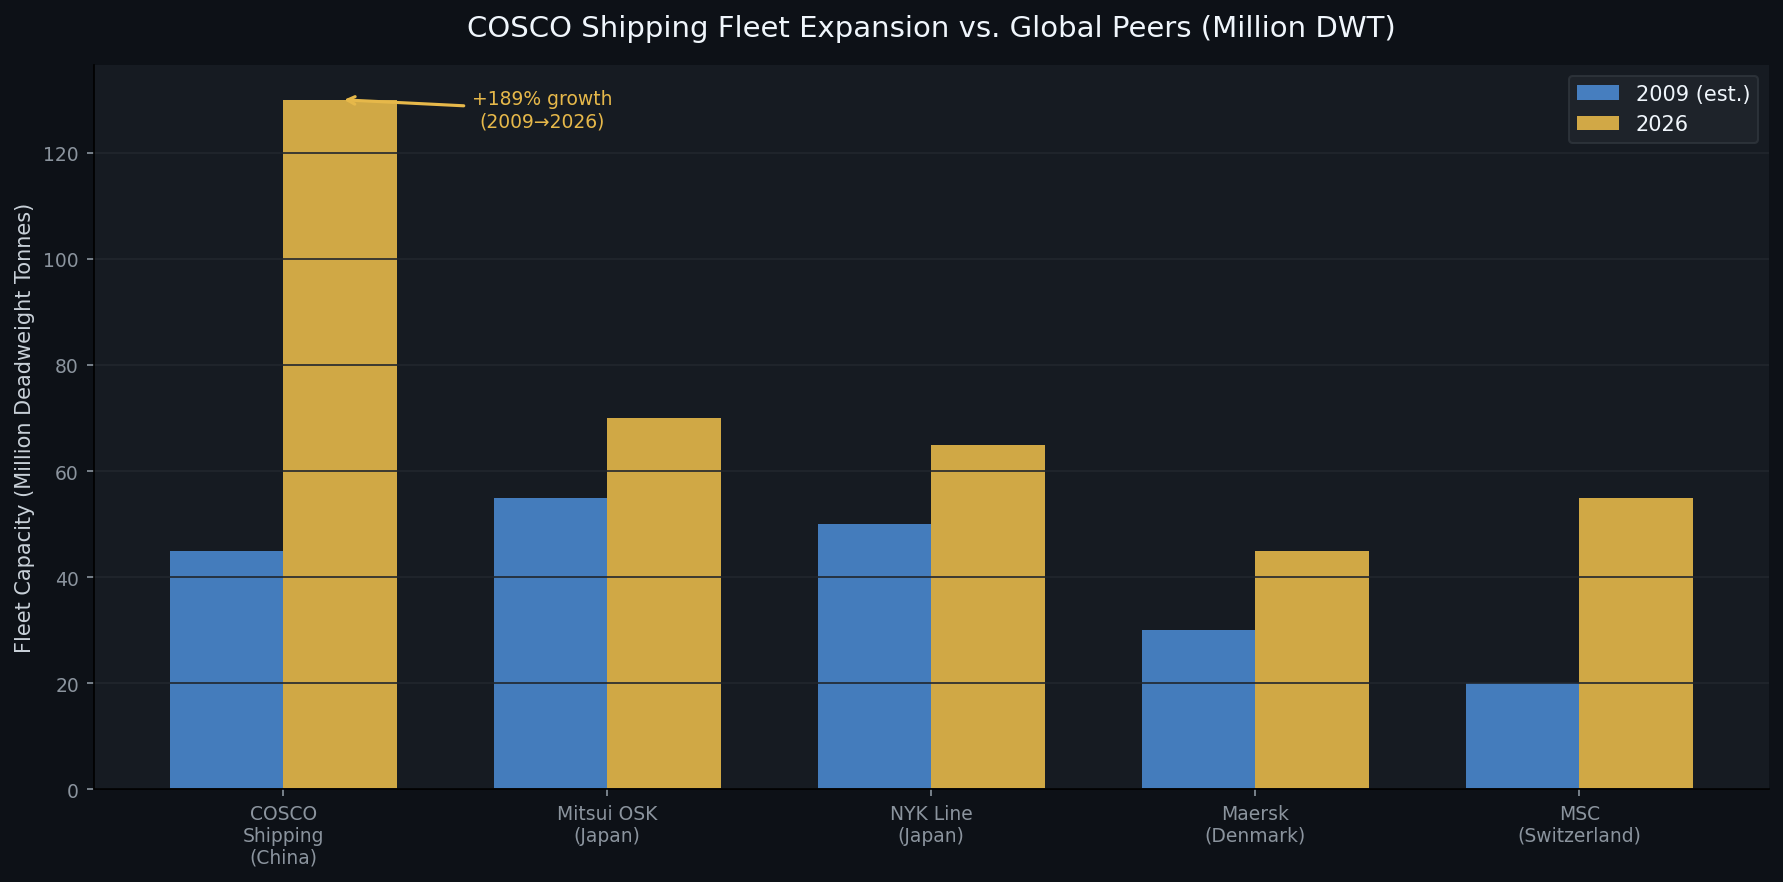
推演揭示,即使石油供應充足,如果西方保險公司(如勞合社)撤銷承保,石油也無法運輸。中國的應對策略有兩方面:首先,如下圖所示,中國大規模擴張了國有的中遠集團(COSCO),其船隊能力在2009至2026年間增長了189%,成為全球最大[註7]。其次,中國建立了由國家支持的海事保險提供商,如中國船東互保協會(China P&I Club),能夠在西方市場撤退時提供戰爭風險保障。
脆弱性 4:美元金融霸權
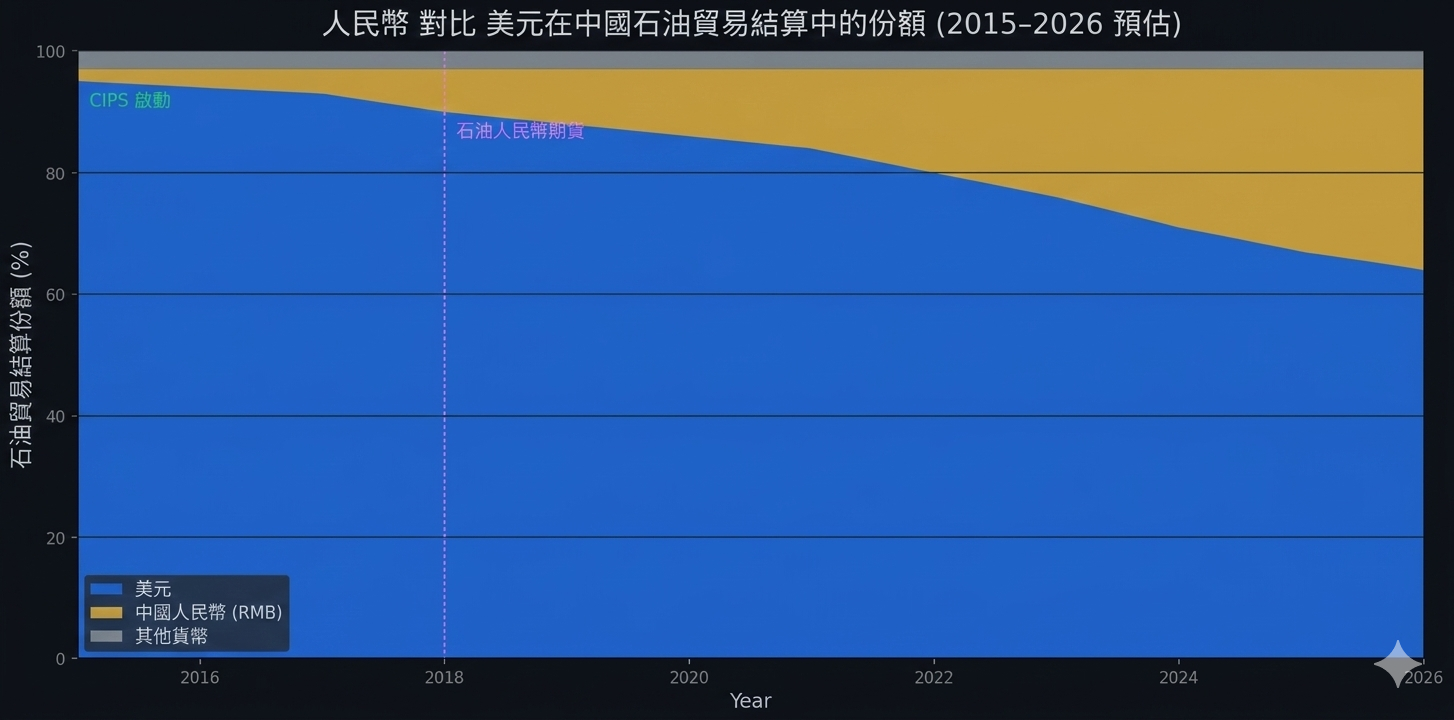
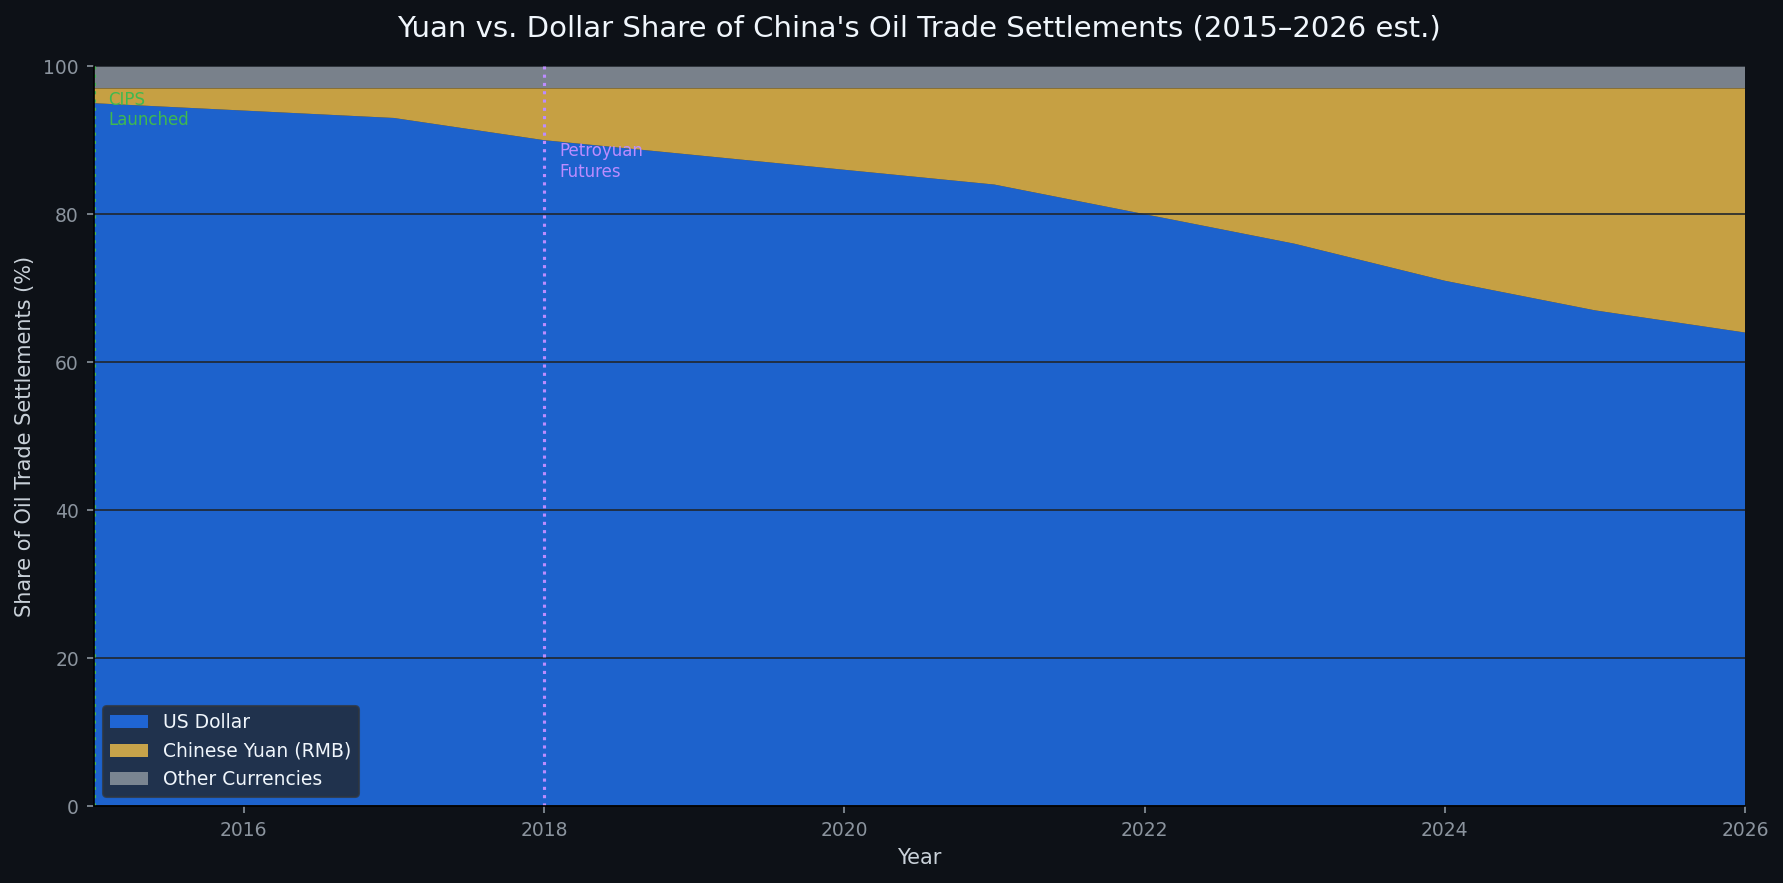
最後,中國採取行動創造了美元金融體系的替代方案。下圖追蹤了人民幣在中國石油貿易的興起。從2015年的接近零,到2026年人民幣的份額估計已達到33%,2022年針對俄羅斯、以及2026年針對伊朗的美元武器化加速了這趨勢[註8]。這些貿易透過中國自身的人民幣跨境支付系統結算,完全繞過了SWIFT和美國銀行體系。
2026年的世界:雙危機故事
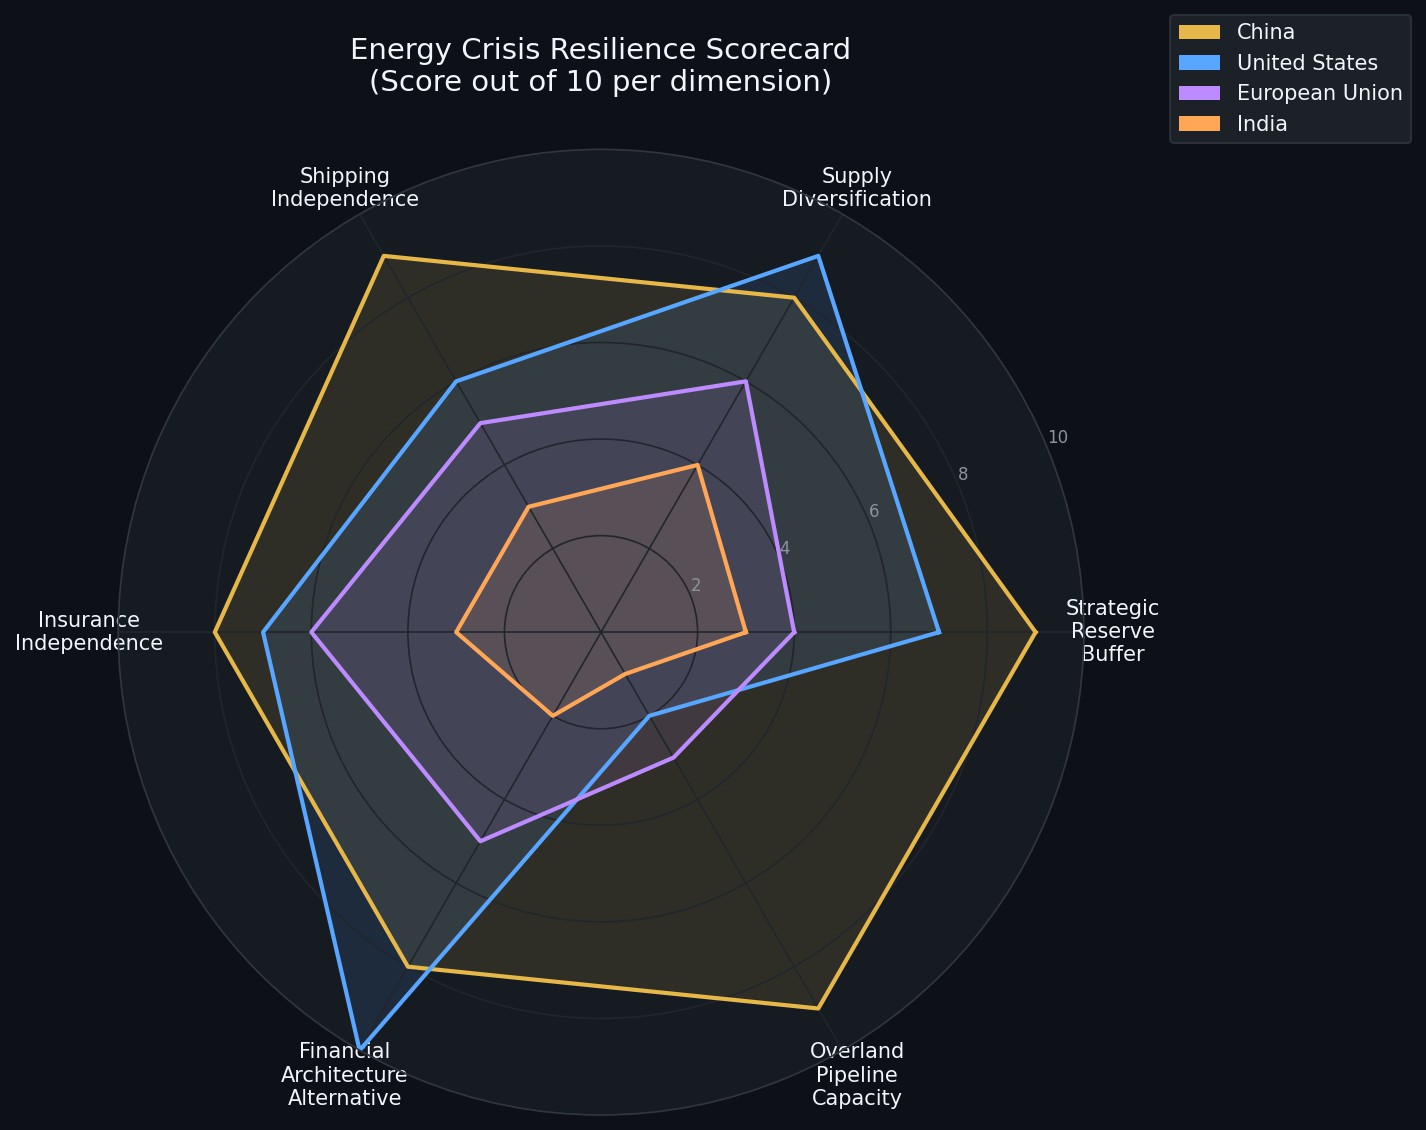
這些不同發展路徑的結果在下圖的能源危機韌性分析數據中顯而易見。在下圖列示的六個關鍵範疇,中國建立的韌性水準遠超美國、歐盟和印度。雖然美國在供應多樣化方面表現良好(歸功於其國內產量),但在儲備緩衝方面較為脆弱、且缺乏外國供應的陸路管道替代方案。歐盟和印度則幾乎在所有範疇都處於嚴重曝露風險狀態。

這引導大家關注當前的危機。下圖以歷史背景分析2026年的石油價格衝擊:目前約每桶110美元的中位價格(因全球約20%的供應缺口導致)仍遠低於推演更嚴峻情況下的峰值水平,如2009年北京推演曾預想伊朗若全面對抗,或會令油價颷高至每桶400美元[註1, 註9];這暗示當前的危機可能仍處於早期階段。

結論
2026年的全球局勢,其實是過去17年可推演預見的結果。「石油衝擊波」推演發出了明確的警告,但只有中國聽取了。藉由系統性地解決弱點,北京不僅保護自己免受當前危機的最壞影響,還為自己在危機中賺得了顯著的戰略與經濟優勢。
當綜合分析這些圖表時,它們描繪的並非周期性危機,而是全球權力的結構性轉移;這種轉移已經過多年的沙盤推演,現正實時上演。
The World in Crisis: How a Decade of War Games Predicted the Geopolitical Landscape of 2026
The global energy and financial crisis of 2026 did not emerge from a vacuum. It is the culmination of geopolitical trends and strategic vulnerabilities that were identified, war-gamed, and broadcast for over a decade. The series of Oil Shockwave simulations, particularly the pivotal 2009 exercise in Beijing, provided a remarkably prescient roadmap for the current situation [1]. While Western nations largely failed to act on the simulations' warnings, China undertook a systematic, multi-trillion-dollar, seventeen-year effort to insulate itself from precisely the vulnerabilities the war games exposed.
This report uses a series of eight data visualizations to narrate this story. It demonstrates how China, starting in 2009, methodically addressed its dependencies on maritime chokepoints, Western shipping and insurance, the US dollar, and its lack of a strategic energy buffer. The result, as the 2026 Iran conflict now demonstrates, is a world where China is the most resilient major economy, while the United States and its allies are the most exposed. The crisis is accelerating a structural shift in global power, away from the unipolar, dollar-denominated system and towards a multipolar world with a robust, parallel financial and logistical architecture centered on Beijing.
The 2009 Beijing Simulation: A Blueprint for a Superpower
The 2009 Beijing simulation was the critical inflection point. As summarized in Chart 8, it identified four existential vulnerabilities for China, then the world's largest and most rapidly growing energy importer.
China's response was not piecemeal; it was a comprehensive, whole-of-government strategy to neutralize each threat. The following sections detail this response, illustrated by the data.
Building the Great Wall of Resilience
Vulnerability 1: No Strategic Buffer
In 2009, China had a negligible strategic petroleum reserve (SPR). The simulation showed this was a fatal flaw. Chart 1 shows the dramatic result of China's policy shift: a near-exponential growth in its strategic and commercial crude stockpiles, from ~160 million barrels in 2009 to an estimated 1.3 billion barrels by 2026 [2] [3]. This massive buffer, representing over 100 days of import coverage, is now the largest in the world and the cornerstone of its crisis response.
Vulnerability 2: Maritime Chokepoint Dependency
China was critically dependent on the Straits of Hormuz and Malacca. To mitigate this, it invested hundreds of billions in overland pipelines. Chart 7 shows the steady growth of this alternative infrastructure. By 2025, China had built over 2.5 million barrels per day of overland oil import capacity and 120 bcm/year of gas capacity, primarily from Russia and Central Asia [4] [5]. These pipelines are immune to maritime blockade.
This was coupled with a diversification of seaborne suppliers. Chart 3 shows the shift from 2009 to 2025. Reliance on Saudi Arabia decreased, while Russia's share grew from 8% to 22%, making it China's single largest supplier [6]. This reduced concentration risk and shifted imports towards a strategic partner with overland routes.
Vulnerability 3: Western Shipping & Insurance Control
The simulation revealed that even if oil was available, it couldn't move if Western insurers (like Lloyd's) withdrew coverage. China's response was twofold. First, as shown in Chart 2, it massively expanded its state-owned shipping company, COSCO, which grew its fleet capacity by 189% between 2009 and 2026, becoming the world's largest [7]. Second, it established its own state-backed maritime insurance providers, like the China P&I Club, capable of providing war risk coverage when Western markets retreat.
Vulnerability 4: US Dollar Financial Dominance
Finally, China moved to create an alternative to the dollar-based financial system. Chat 4 tracks the rise of the yuan in China's own oil trade. From near zero in 2015, the yuan's share is estimated to have reached 33% by 2026, a trend dramatically accelerated by the weaponization of the dollar against Russia in 2022 and Iran in 2026 [8]. This trade is settled through China's own CIPS payment system, bypassing SWIFT and the US banking system entirely.
The World in 2026: A Tale of Two Crises
The result of these divergent paths is starkly illustrated in Chart 5, the Energy Crisis Resilience Scorecard. Across six key dimensions, China has built a level of resilience that far surpasses that of the US, EU, and India. While the US scores well on supply diversification (due to its own production), it is vulnerable on its reserve buffer and has no overland pipeline alternatives for foreign supply. The EU and India are critically exposed across almost all dimensions.
This brings us to the current crisis. Chart 6 puts the 2026 oil price shock in historical context. The current mid-range price of ~$110/barrel, resulting from a ~20% global supply shortfall, is still far below the peak levels modeled in the more severe simulations, such as the 2009 Beijing exercise which contemplated a full Iran confrontation and a resulting price of $400/barrel [1] [9]. This suggests that the current crisis may still be in its early stages.
Conclusion
The global situation in 2026 is the direct, predictable outcome of the strategic choices made over the past seventeen years. The Oil ShockWave simulations offered a clear warning, but only China heeded it. By systematically addressing its vulnerabilities, Beijing has not only protected itself from the worst of the current crisis but has positioned itself to gain significant strategic and economic advantage from it. The charts, when viewed together, do not depict a cyclical crisis; they depict a structural transfer of global power, one that was war-gamed for years and is now unfolding in real-time.
註 References:
Wilkerson, L. (2012, March 2). The Iran War Game That’s Shaking Up the Pentagon. Vanity Fair. Retrieved from https://www.vanityfair.com/news/daily-news/2012/03/lawrence-wilkerson-middle-east-nancy-schoenberger-israel-iran-nuclear-weapons
U.S. Energy Information Administration. (2025, October 9). Expanding strategic oil stocks in China support crude oil prices. Today in Energy. Retrieved from https://www.eia.gov/todayinenergy/detail.php?id=66319
Reuters. (2025, September 8). China to maintain oil stockpiling in 2026, Gunvor strategist says. Retrieved from https://www.reuters.com/business/energy/china-maintain-oil-stockpiling-2026-gunvor-strategist-says-2025-09-08/
Reuters. (2024, December 2). China completes full pipeline for Power-of-Siberia gas. Retrieved from https://www.reuters.com/business/energy/china-completes-full-pipeline-power-of-siberia-gas-2024-12-02/
Center for European Policy Analysis. (n.d.). A Limited Lifeline: Russia's Role in China's Energy Security. Retrieved from https://cepa.org/commentary/a-limited-lifeline-russias-role-in-chinas-energy-security/
Neufeld, D. (2025, September 2). Visualizing China's Crude Oil Imports by Country. Visual Capitalist. Retrieved from https://www.visualcapitalist.com/chinas-crude-oil-imports-by-country/
COSCO SHIPPING Holdings Co., Ltd. (2024, March 28). Annual Results 2023. Retrieved from http://en.hold.coscoshipping.com/cms_files/filemanager/1664/attach/20243/223694A61A41E DCC7A71B6ACE6EAAD3B.pdf
Ma, S. (2025, January 16). China’s yuan on the rise in oil trade, but petrodollar here to stay: report. South China Morning Post. Retrieved from https://www.scmp.com/economy/global-economy/article/3295048/chinas-yuan-rise-oil-trade-petrodollar-here-stay-report
Bipartisan Policy Center. (2005). Oil ShockWave: Simulation Report and Summary of Findings. Retrieved from https://bipartisanpolicy.org/wp-content/uploads/2019/03/oil_shockwave_report_440cc39a643cd.pdf


")


